SmartMine IoT: Collision Awareness Solution (CAS) - Underground

Discover how SmartMine’s CAS solution can help you increase employee wellness, remain compliant and potentially increase productivity in your Underground mining operation

Address challenges

Data Driven Insights

Analytics for Collision Risk Assessment
Analytics for Collision Risk Assessment

Analysing data enables proactive identification of collision risks, allowing for preventive measures to be implemented, thus enhancing safety.

Enhanced Safety measures

Enhanced Safety measures

Data-driven insights enable the implementation of targeted safety measures, reducing the likelihood of accidents and injuries in mining operations.

Operational Efficiency

Operational Efficiency

Leveraging data for decision-making optimises workflows, resource allocation, and equipment usage, driving operational efficiency and productivity.

Data-Driven Decision making

Data-Driven Decision making

Utilising data enables informed decision-making, leading to optimised processes, reduced downtime, and improved overall performance.

 
Improved Compliance and Reporting

Improved Compliance and Reporting

Data insights facilitate adherence to compliance standards, particularly Level 9, streamlining reporting processes and ensuring regulatory requirements are met effectively.

Key Benefits of the SMartMine IoT - Collision Awareness Solution for Underground

Improved Safety

Identify risks, implement targeted safety measures like speed restrictions or enhanced signage in frequent near-miss zones.
Improved Safety

  • Identify high-risk areas and behaviours.
  • Implement targeted safety measures, e.g. implementing speed restrictions or signage in areas of frequented near misses.
Continuous Improvement through Data Analysis

Continuous analysis refines collision awareness strategies, ensuring adaptive system evolution and enhanced safety measures over time.

Continuous Improvement through Data Analysis

  • Analysis of insights leads to ongoing refinements in collision awareness strategies.
  • This ensures that the system evolves over time, staying adaptive to changing conditions and advancing safety measures.
Optimised equipment utilisation

The SmartMine CAS Reporter offers insights into equipment usage, aiding in optimisation and minimising downtime.

Optimised equipment utilisation

  • SmartMine CAS Reporter provide insights into equipment usage patterns, downtime reasons, and operational inefficiencies.
  • Analysis of this data, helps with optimising equipment utilisation, proactively scheduling maintenance, and minimising costly downtime.
Optimized Traffic Flow

SCAS analyses traffic data to optimise flow, potentially leading to fuel savings and improved efficiency.

Optimized Traffic Flow

  • SCAS provides insights into traffic patterns, congestion hotspots, and bottlenecks within the mine site. Analysing these insights, strategies can be implemented to optimise traffic flow, such as adjusting haulage routes, optimising vehicle scheduling, or deploying traffic management personnel to redirect traffic away from congested areas.
  • This optimisation could lead to fuel savings, decreased equipment wear, and enhanced overall operational efficiency.

User Interface Dashboards

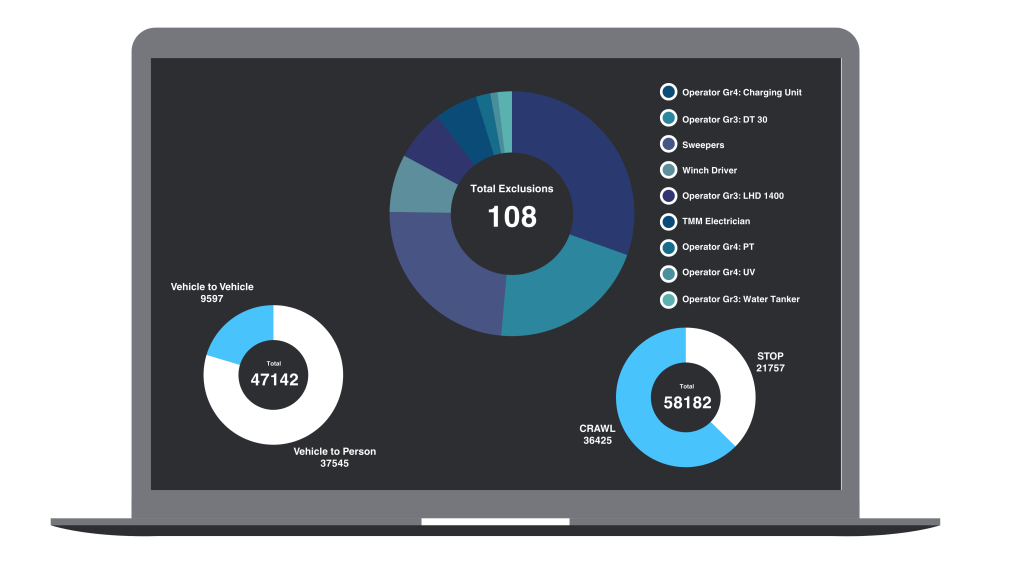
Holistic view, LEVEL 9, STOP and CRAWL events.
  • Enable improved assessments on site wide level 9 interactions.
  • Historical data and trends of level 9 interactions
  • Insights into dangerous occurrences and near-misses.
  • Insights into congestion patterns during shifts.
  • Risk Profile Visibility: allows visibility of top persons and vehicles responsible for STOP and CRAWL events to facilitate corrective action.
Monitoring
  • Vehicle-to-Vehicle/Vehicle-to-Person/Vehicle-to-Hazard detection. 
  • Investigate historical STOP and CRAWL events leading up to incidents.
  • Exclusion events analysis.
  • CAS System health diagnostics dashboard.
  • Data-logging and reporting.
  • Manual and/or Automated Reporting.
  • E-mail and WhatsApp alerts.
Holistic view, LEVEL 9, STOP and CRAWL events.
  • Enable improved assessments on site wide level 9 interactions
  • Historical data and trends of level 9 interactions
  • Insights into dangerous occurrences and near-misses.
  • Insights into congestion patterns during shifts.
  • Risk Profile Visibility: allows visibility of top persons and vehicles responsible for STOP and CRAWL events to facilitate corrective action.
Monitoring
  • Vehicle-to-Vehicle/Vehicle-to-Person/Vehicle-to-Hazard detection. 
  • Investigate historical STOP and CRAWL events leading up to incidents.
  • Exclusion events analysis.
  • CAS System health diagnostics dashboard.
  • Data-logging and reporting.
  • Manual and/or Automated Reporting.
  • E-mail and WhatsApp alerts.
SmartMine IoT Cas - Key Features
  • Shift Congestion monitoring and assessment.
  • High risk interaction assessment.
  • Incident capturing and investigation. 
  • Monitoring and assessing of unsafe acts and conditions. 
  • Pedestrian / Operator risk behaviour. 
  • CAS system includes Availability, Utilisation, Reliability and Condition Monitoring. 
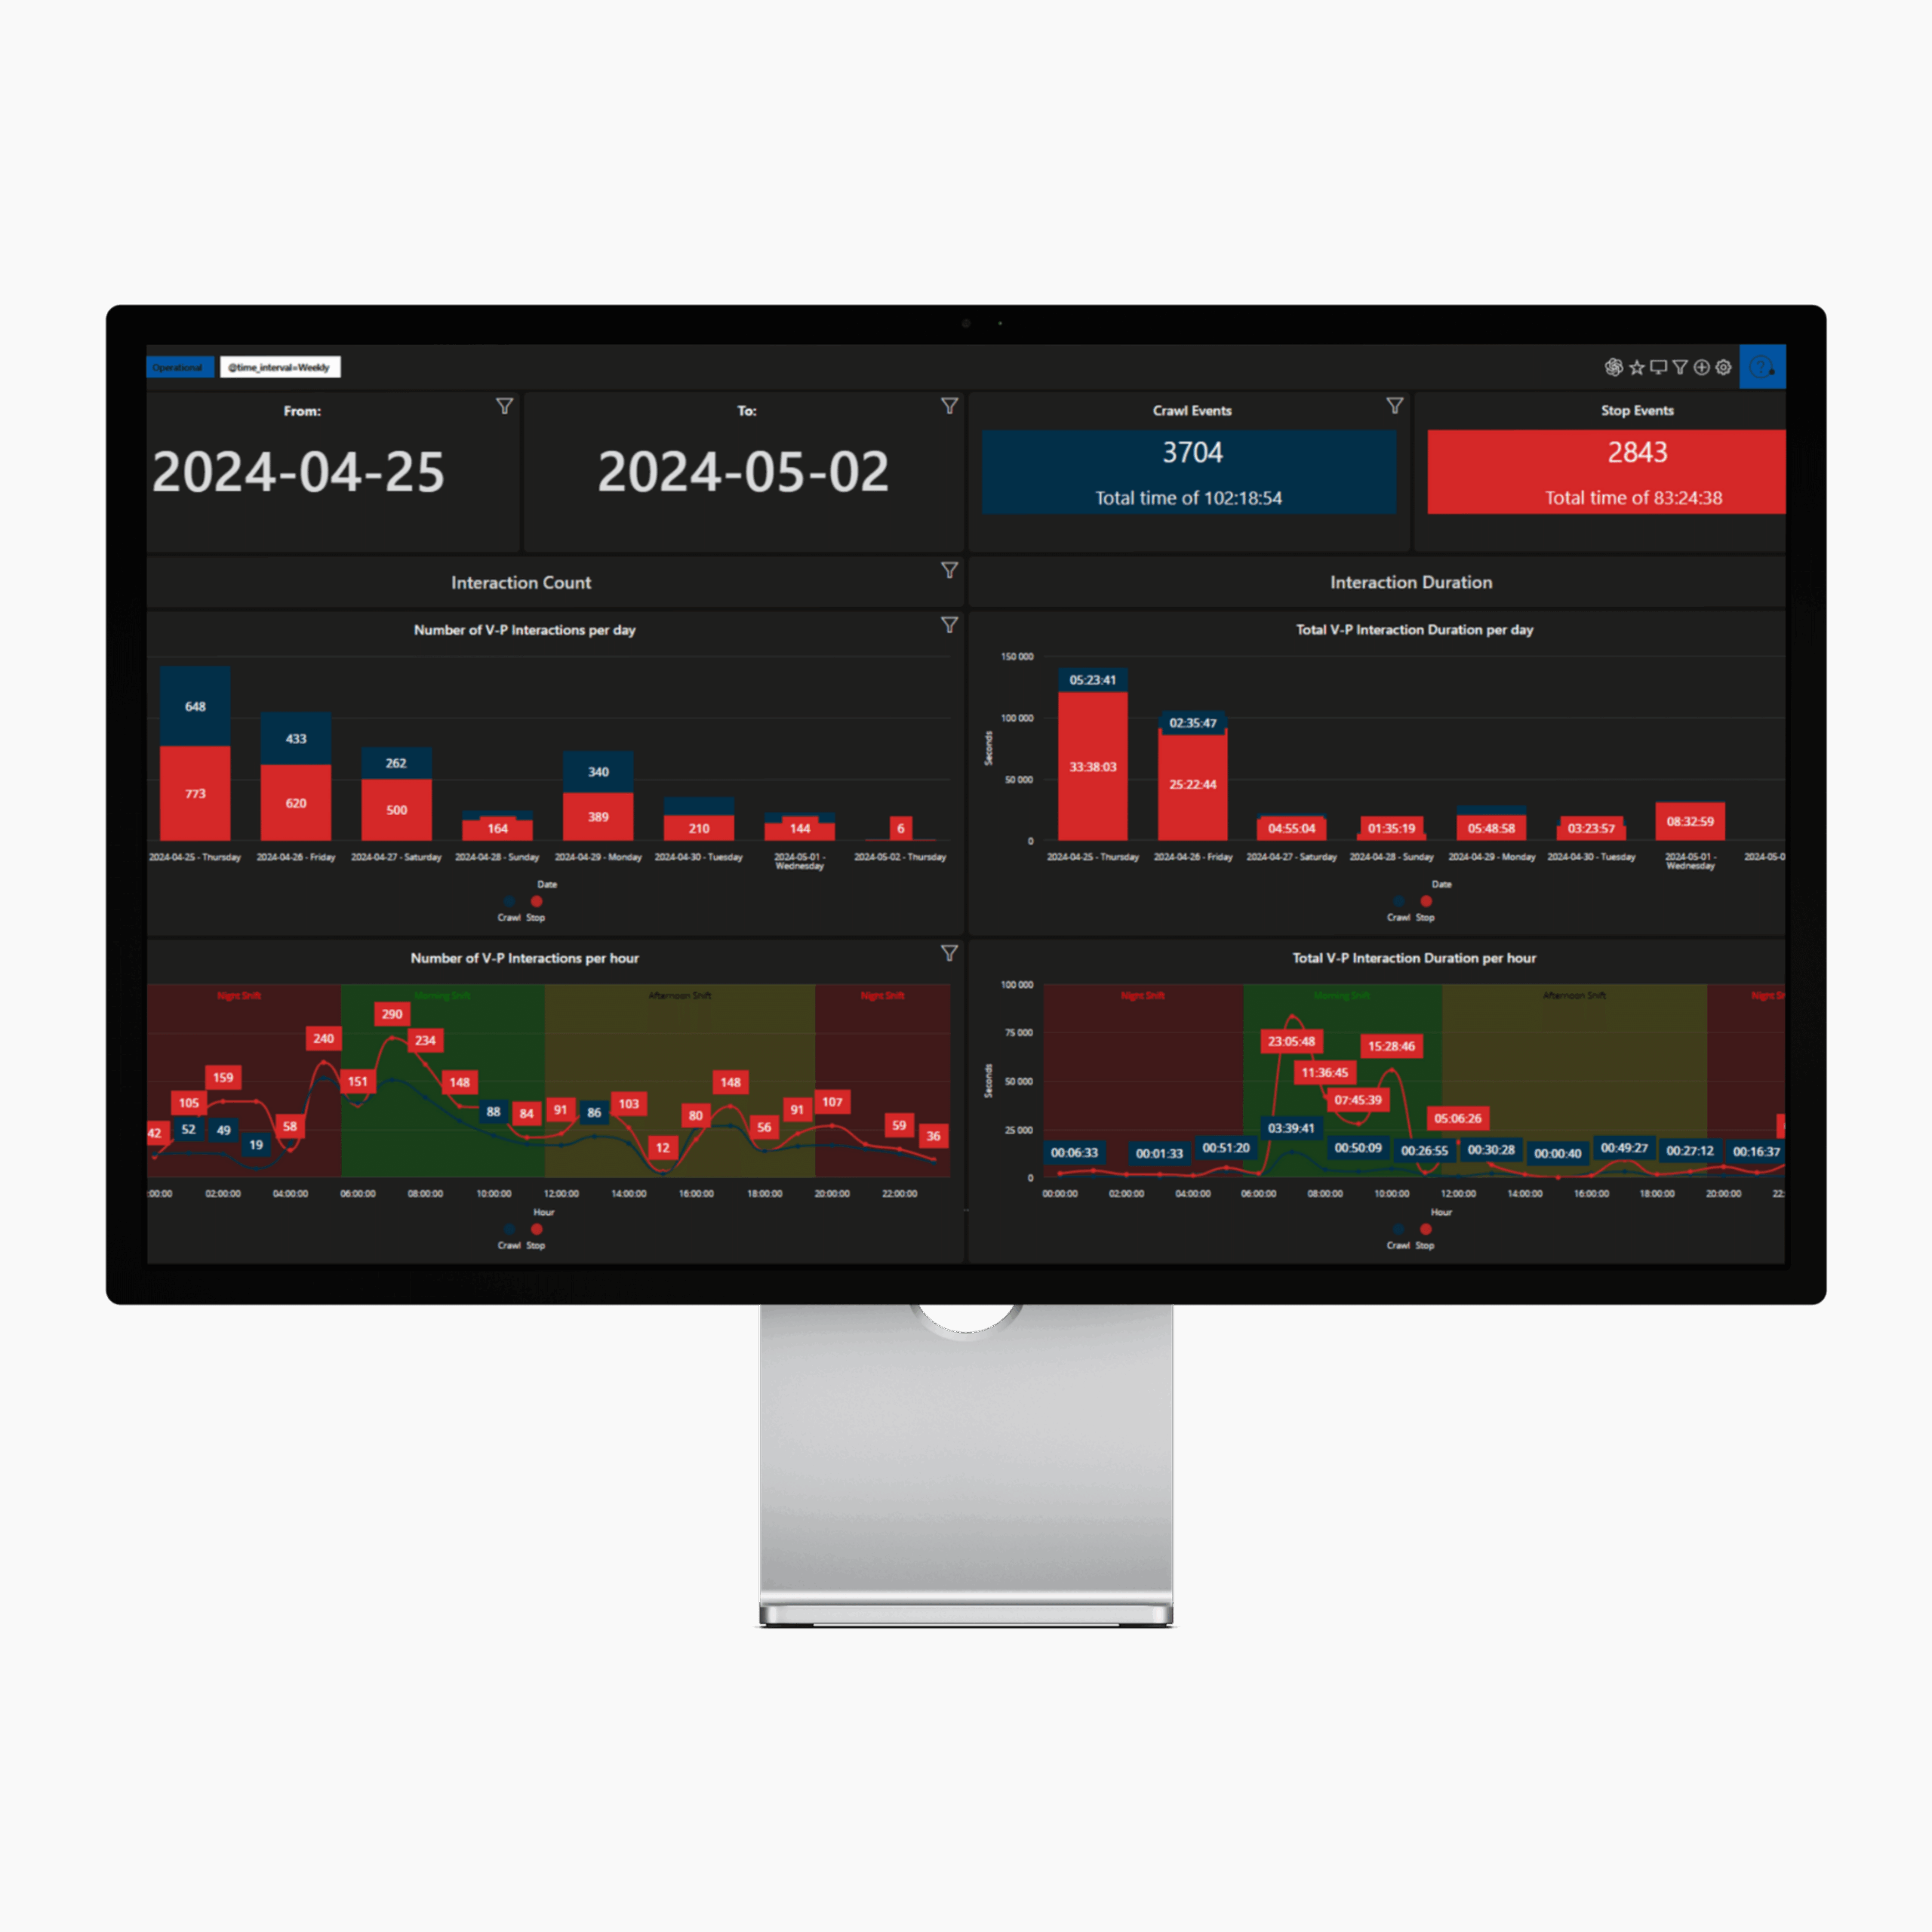
CAS Dashboard – Visibility into Interactions
  • Gain full operational awareness of all vehicle and pedestrian interactions in one intuitive view.
  • Quickly identify high-risk zones or times to implement preventive safety measures.
  • Prioritise safety reviews and risk mitigation strategies based on actual interaction frequency and severity.
  • Enhance accountability by making patterns of unsafe behaviour visible and trackable.
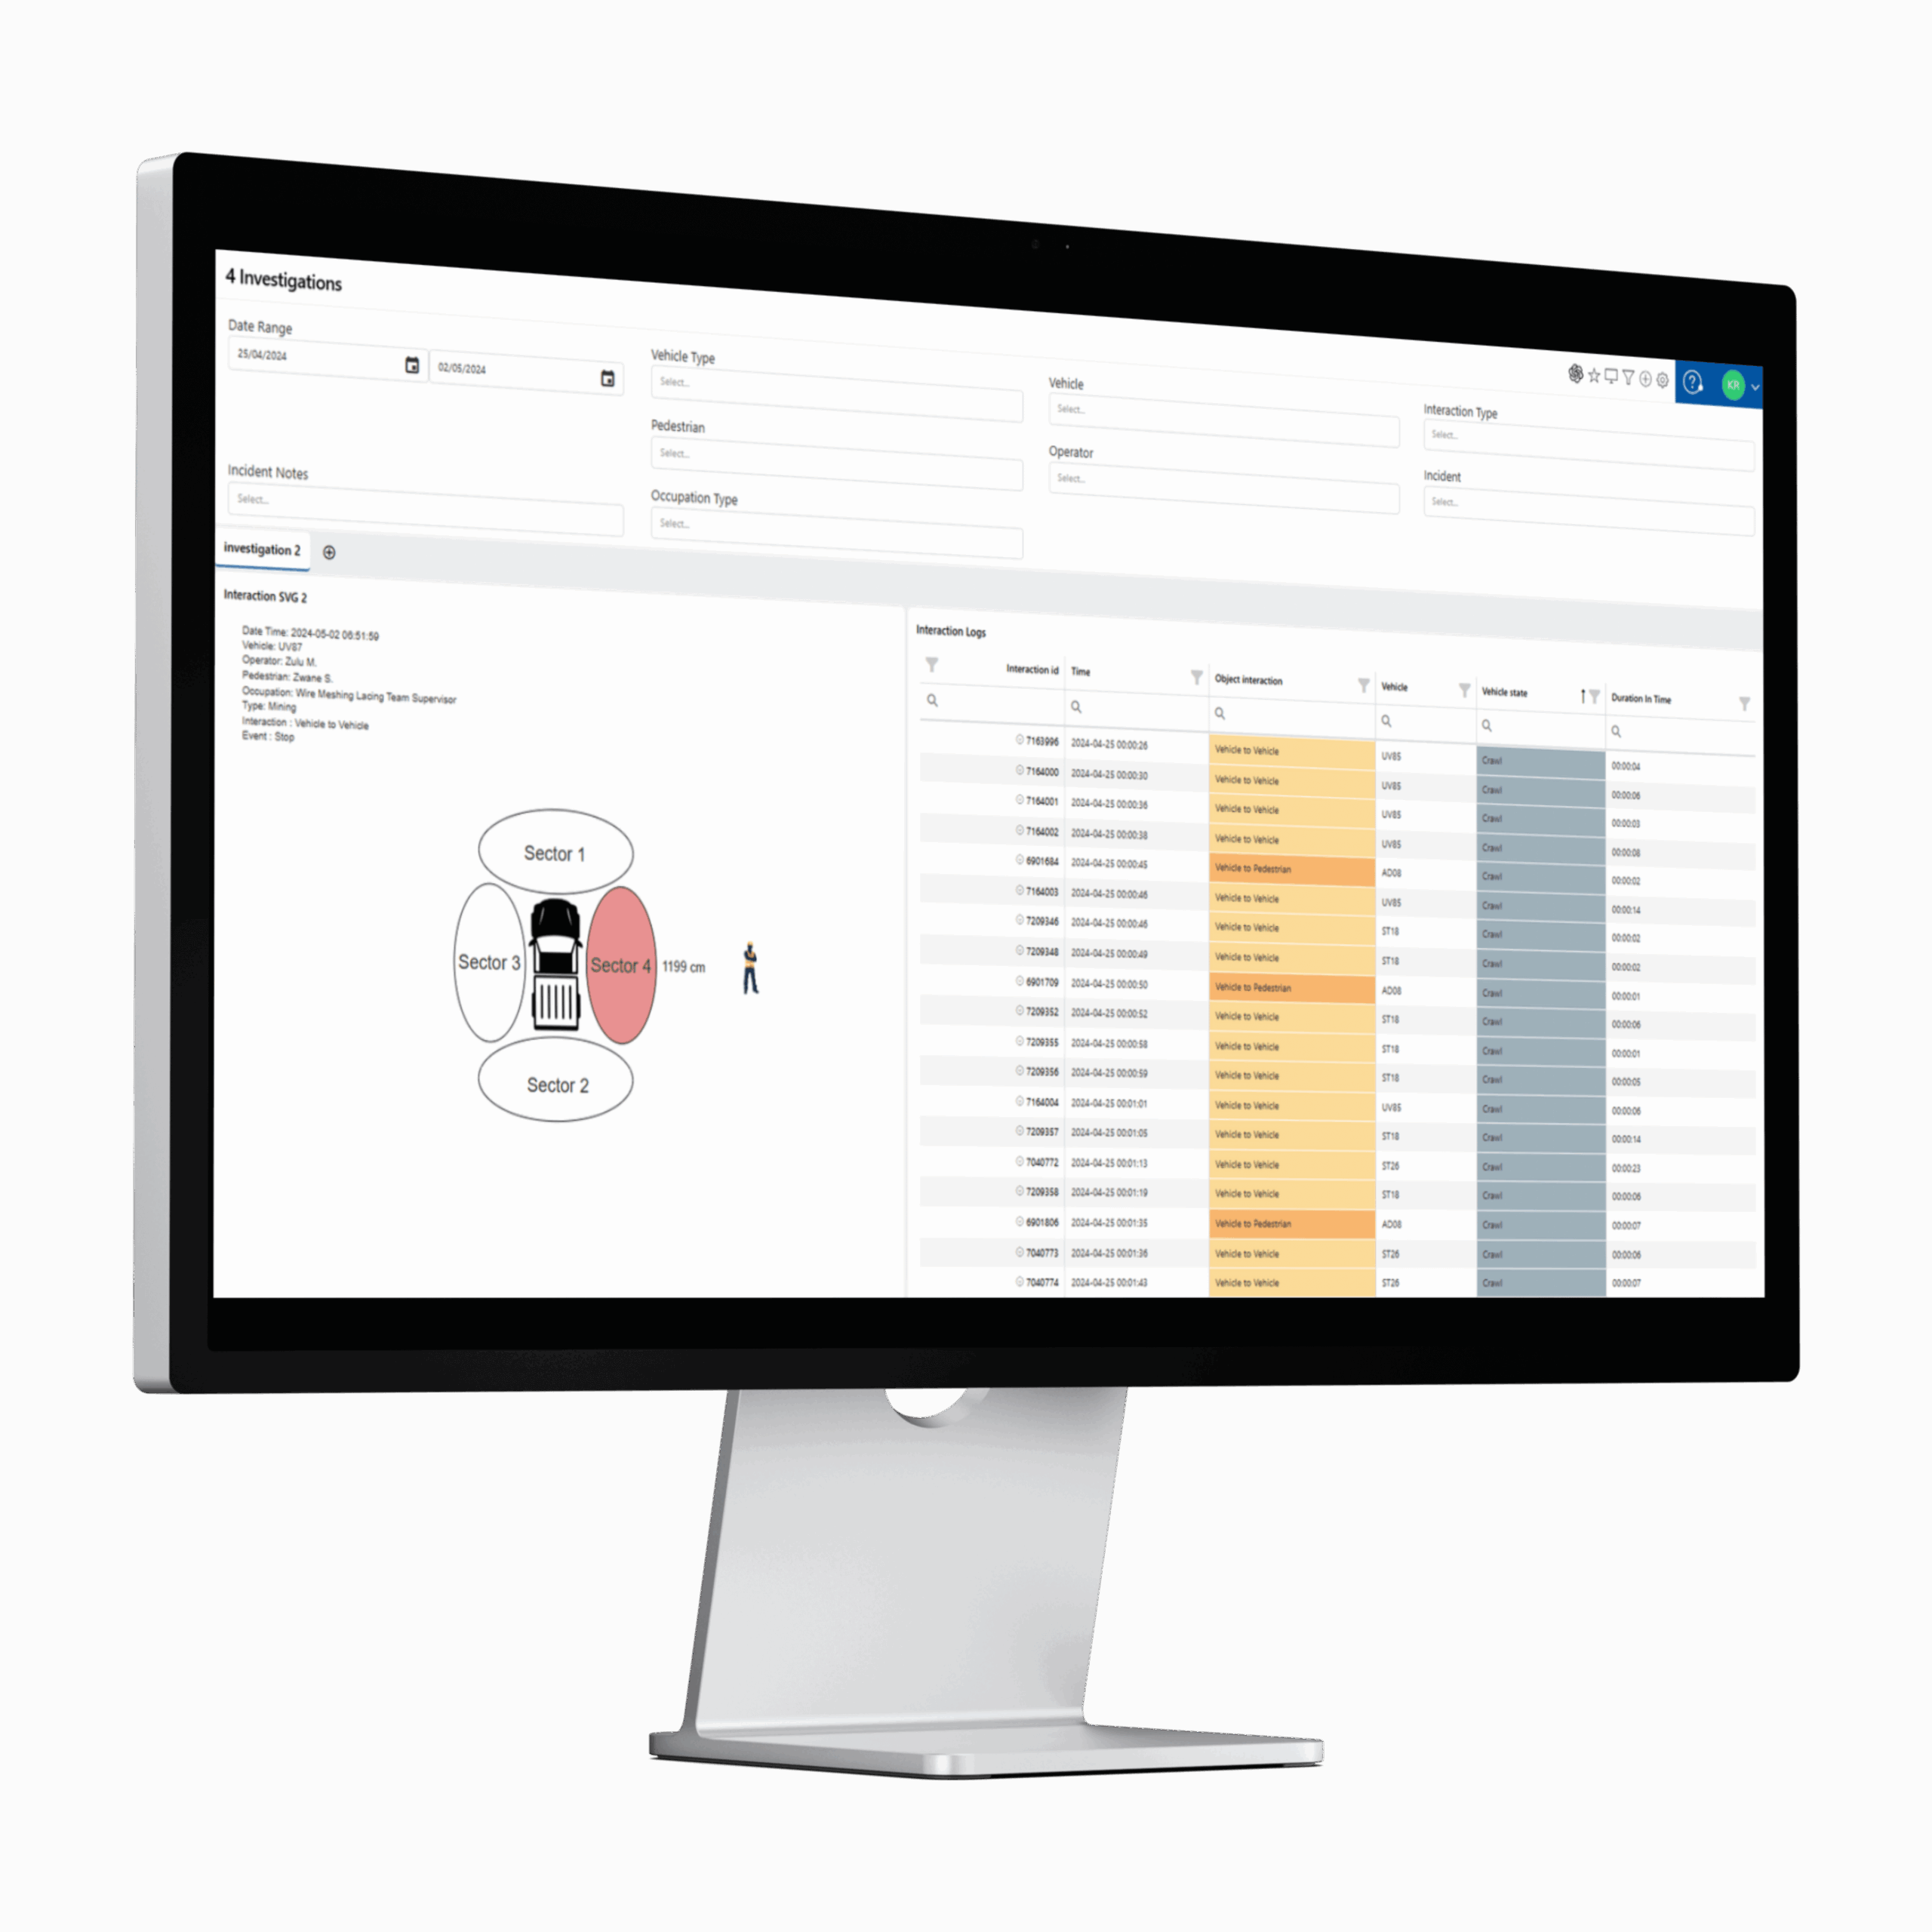
Investigation Dashboard – Incident Analysis & Reporting
  • Investigate incidents, dangerous occurrences or near misses with precision and supporting data at your fingertips.
  • Simplify compliance with ready-to-export reports aligned with regulatory requirements.
  • Strengthen root-cause analysis and reduce repeat incidents through detailed breakdowns.
  • Reduce investigation turnaround time by centralising all incident data in one dashboard.
  • Improve confidence in your safety reporting processes with consistent, traceable evidence.
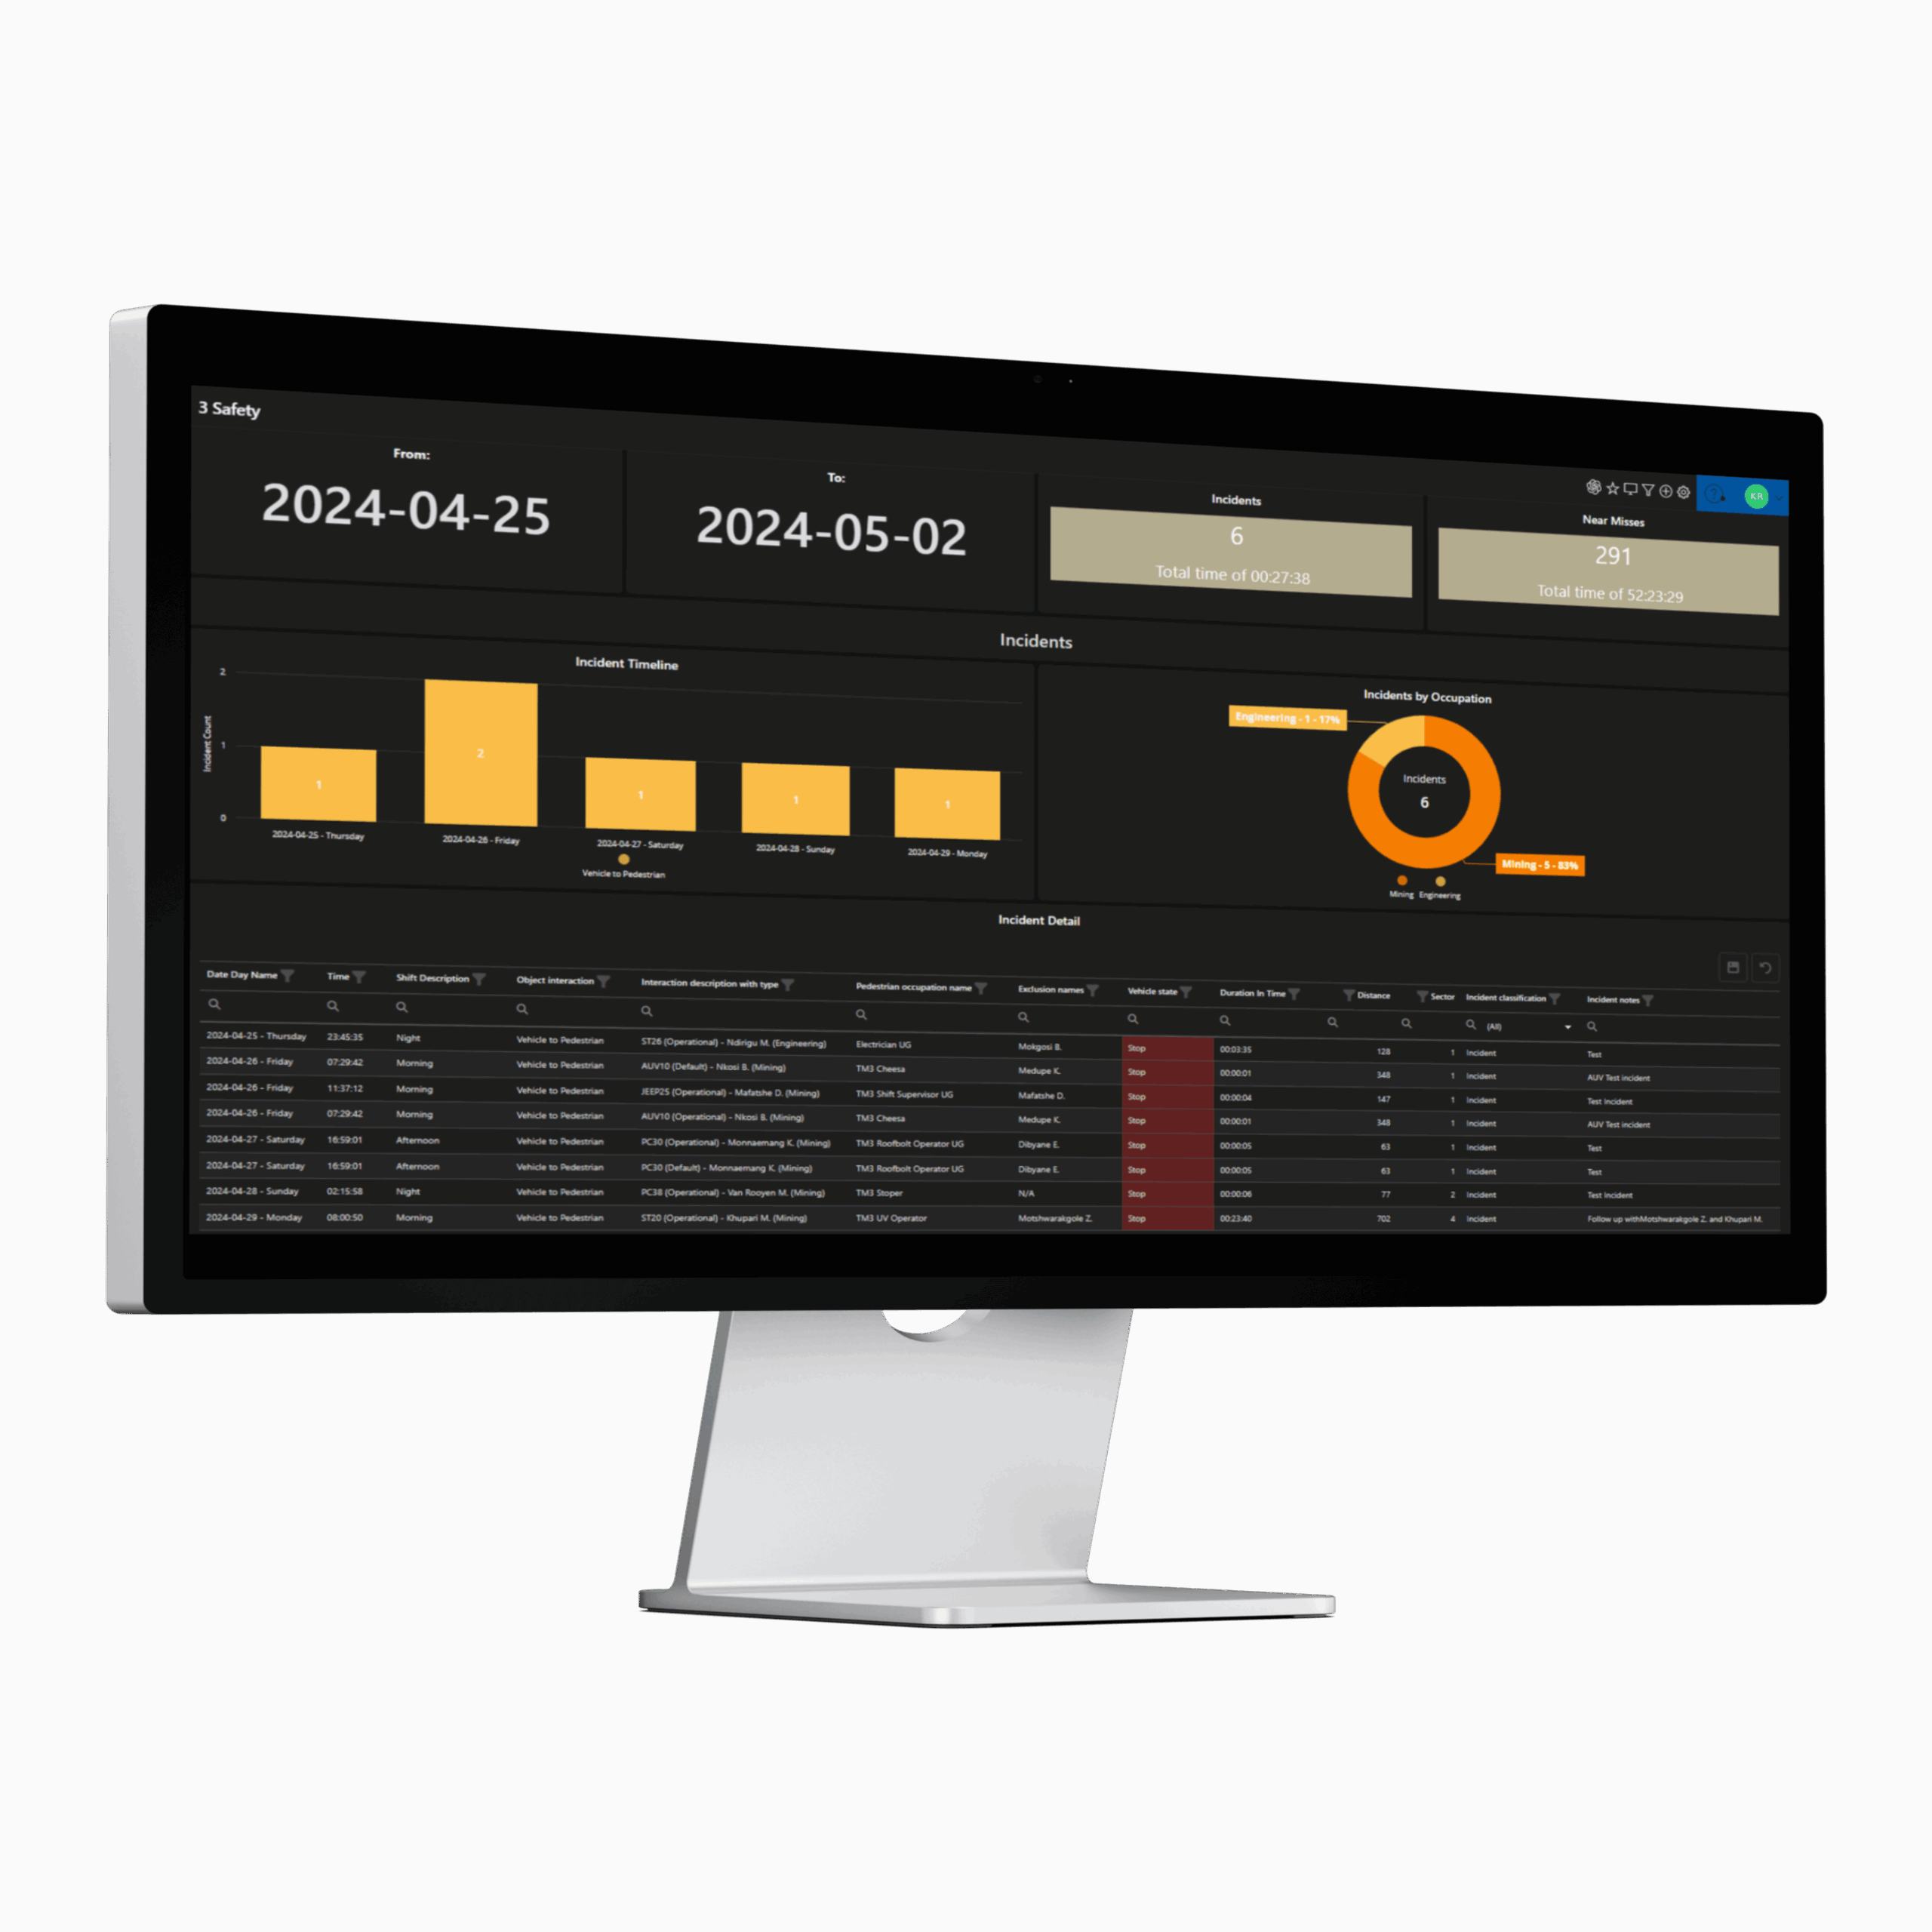
Safety Dashboard – Holistic Safety Oversight & Risk Intelligence
  • Spot emerging risks early by tracking and analysing near misses before they escalate into actual incidents.
  • Tag interactions as incidents for ease of reporting and incident history searches.
  • Visualise the full scope of safety threats, with breakdowns by vehicle and pedestrian to uncover vulnerable points in operations.
  • Identify patterns across near misses and incidents, helping you target high-risk behaviours, areas or operational bottlenecks.
  • Recognise and address “unhealthy” PDS systems that consistently appear in interaction or incident data, preventing future risks.
  • Build a proactive safety culture, turning near miss tracking into a tool for awareness, education, and continuous improvement.
  • Enable transparent incident tracking, ensuring teams and leadership have a shared understanding of safety performance.
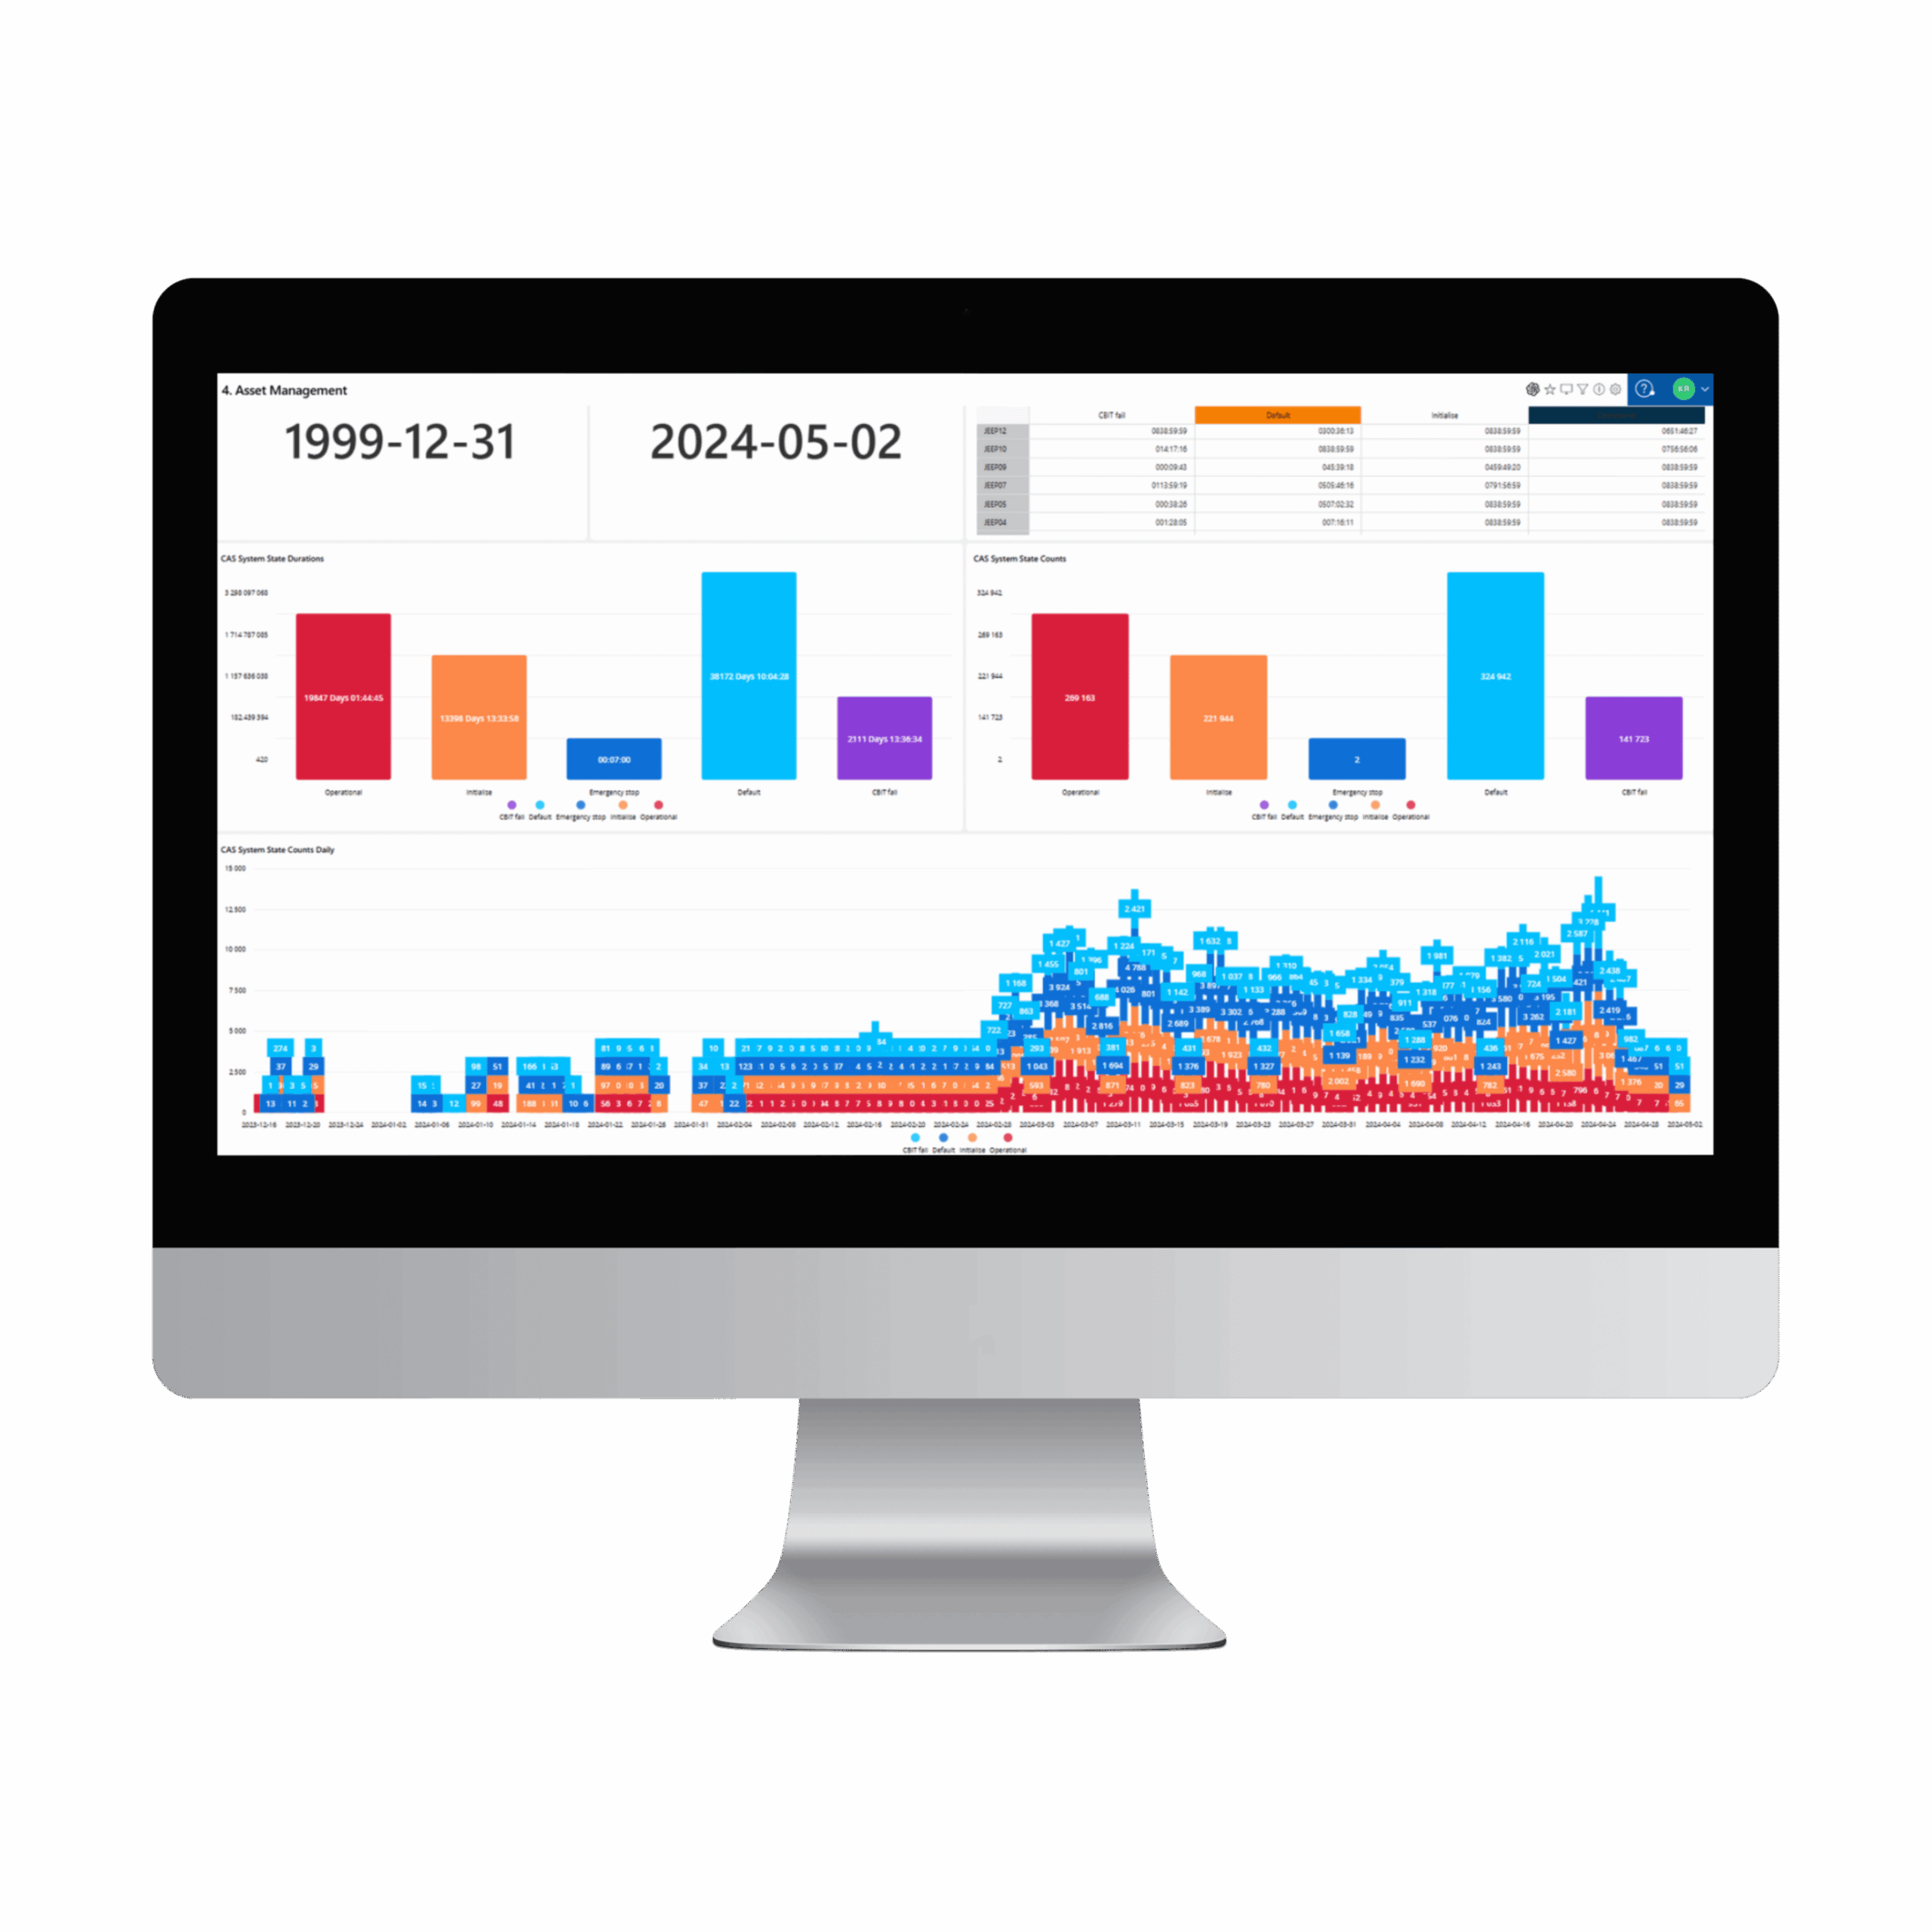
Asset Management Dashboard – Utilisation & Availability
  • Maximise fleet productivity by identifying underused or idle assets across shifts based on PDS systems states.
  • Reduce unplanned downtime by tracking how systems are performing and taking corrective maintenance.
  • Ensure each PDS system is functioning optimally by comparing performance across the fleet.
  • Track operator usage and performance based on PDS systems states.
Infrastructure Dashboard – System & Network Health
  • Monitor the availability and health of your CAS ICT infrastructure to ensure optimal connectivity and data collection for complete insights.
  • Monitor latency in data uploads and downloads to determine whether commination coverage is optimal faster decision-making.
Scroll to Top